Actionable ALM: The Benefits of Integrated Asset and Liability Management and Decision-making by Leveraging Enhanced Business Intelligence Tools

In today's rapidly changing economic and market environment, insurance companies face numerous challenges. These challenges encompass a wide range of factors, from the rapidly rising interest rates to geopolitical uncertainty. To navigate these challenges successfully, insurance companies should leverage available data and modern technology to make informed decisions and stay ahead of the curve. One useful tool is business intelligence (BI) software that empowers insurance companies to streamline their data-driven decision-making processes, improve risk management, and optimize operations to meet the evolving demands of customers and achieve strategic objectives.
This article introduces a forward-looking, action-driven asset liability management (ALM) reporting framework and then explores the benefits of leveraging BI tools in ALM decision-making. Lastly, a case study is presented to illustrate the practical applications of BI tools. Through this case study, readers will gain a deeper understanding of the tangible benefits and transformative potential of BI in real-world scenarios.
Introduction to ALM Reporting Framework
A comprehensive ALM reporting package should include a collection of management reports and charts that summarize the company’s asset and liability positions, as well as attribution of asset and liability value changes by key drivers, and tail risk measurements.
The ALM reporting framework typically involves four steps:
- Define ALM metrics: The metrics should be comprehensive and provide insights on the key risks that impact asset and liability values. A non-exhaustive list of metrics includes cashflow profiles, market and book values, gross and net yields, defaults and spreads, and interest rate and credit durations and convexities.
- Define key risk drivers: Insurers should define a set of key risk drivers that are common to both assets and liabilities. By using a common set of risk factors, the company can measure value changes from both sides of the balance sheet (i.e., risk-factor based attribution) and assess net exposures against its own risk appetite and tolerance.
- Establish risk exposure limits and management “playbook”: Once risk drivers are defined, insurers should set tolerance levels for each risk driver based on stress testing or other techniques. The risk exposures should be monitored closely against the limits. Insurers should establish a set of management actions to be taken in the event that risk exposures approach or exceed the defined limits.
- Take management action: When risk exposures approach the defined limits, management can refer to the playbook and choose the appropriate management action for risk mitigation. If the company receives significant benefits or payoffs by taking on a specific risk (e.g., net mark-to-market gains under rising interest rate environment due to significantly longer liability duration than asset duration), then management may choose to temporarily maintain the exposure level (i.e., no management actions) or execute management actions to lock-in the positive economic value (e.g., asset rotation or interest rate hedging). In the case of no management actions being taken, management needs to be aware of the potential downside risks (e.g., interest rate moves in the opposite direction, driving net economic asset value to drop).
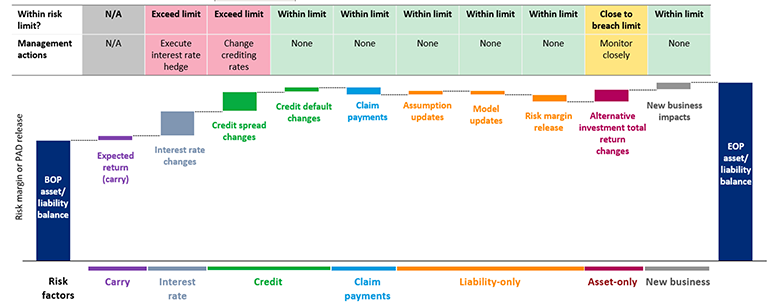
Exhibit 1 is an illustrative example of common risk factor-based attribution that can be applicable to attribute value changes for both assets and liabilities.
Exhibit 1
Risk-factor Based Attribution
Exhibit 1 shows a set of common economic and non-economic risk factors that impact insurers’ asset and liability values. These risk factors are only for illustration purpose, and each company should build their attribution based on its own risk profile.
The ALM reporting framework provides the following key benefits that allow insurers to stay informed and competitive:
- More robust risk control and business stability:
- Clarity on whether risk taking activities are appropriately compensated.
- Agility in responding to changing market conditions.
- Effective risk management.
- Opportunities to improve risk-adjusted return through better usage of financial resources:
- Monitoring of investment performance against liability value changes and tailored risk limit and tolerance.
- Transparency around where and how value is created against the company’s risk appetite and limits.
- Actionable metrics to inform management action on improving ALM position.
Benefits of Business Intelligence Tools
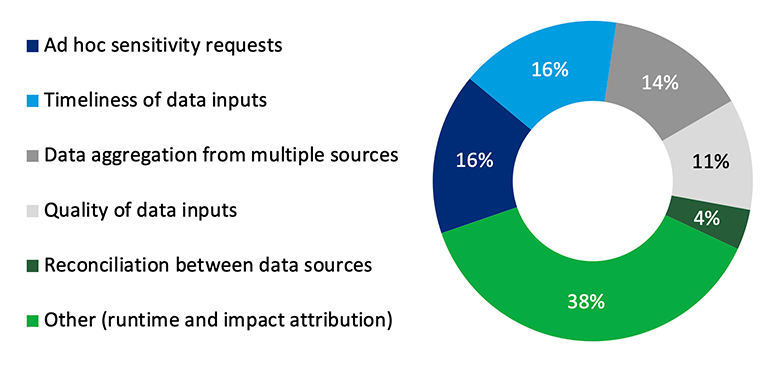
ALM reporting can present various challenges to insurers in terms of data quality and timeliness, metric complexity, and cross-team collaboration. According to Oliver Wyman’s 2023 ALM survey, over 60% of participants selected one of these challenges as a top challenge in ALM reporting, illustrated in Exhibit 2 below. Only 57% of participants indicated they are able to spend more time on analysis than model maintenance.
Exhibit 2
ALM Reporting Challenges
In recent years, insurers have embraced BI tools to enhance the ALM reporting process and strategic decision-making. These tools quickly and efficiently generate comprehensive reports and visualizations that highlight underlying drivers of performance and the impact of various risk factors.
Key benefits of BI tools include:
- Access to real-time data from various sources:
BI tools have the capability to collect and integrate data from multiple sources, enabling management to access pre-defined metrics as well as perform their own ad hoc analysis. Data within the BI tool is continuously updated in real-time, empowering management with dynamic and actionable insights based on the most current and relevant information. When combined with a pre-defined playbook, management is provided with real-time access to data and insights, enabling them to respond swiftly to changes in the economic environment. - Business oriented interactive “what-if” analytics:
BI tools provide user-friendly interfaces and self-service capabilities, allowing business users to independently access and analyze data with less reliance on IT support or interacting directly with the underlying data. By reducing the reliance on IT support, BI tools streamline the decision-making process and promote agility within organizations. Business users can create customized reports and visualizations tailored to their needs, empowering them to make faster and more informed decisions. - Enhanced productivity:
By providing streamlined processes to access data and generate reports in real-time, BI tools eliminate the need for manual data gathering and manipulation. This allows employees to focus on value-added tasks and gain insights into the available data. Additionally, BI tools offer features such as data visualization and interactive dashboards, which enable users to quickly interpret complex data sets. This enhanced productivity also empowers management to make data-driven decisions and take proactive actions to drive business growth. - Version control and information sharing:
BI tools provide collaboration features that enable users to share reports and dashboards with other stakeholders within the organization. This promotes information sharing and reduces the risk of working with outdated or conflicting information. To increase traceability, BI tools include version control capabilities that track changes made to reports over time and allows teams to build upon the same version of the BI tool.
Conclusion
ALM dashboards serve as valuable decision-making tools for insurance companies in today’s rapidly changing environment. Coupling the ALM dashboard with BI tools addresses operational challenges associated with growing data size and multiple data sources, enabling organizations to effectively analyze and manage key risks embedded in their business.
Case Study—ALM Dashboard
The life insurance company XYZ manages ALM on an economic basis. Their ALM report has been fairly basic and simple over the past 20 years. The ALM report was produced in Excel which required the ALM team to gather data from various areas within the organization and perform manual data processing and manipulation. The end-to-end ALM reporting processes took about three months to complete. As rates have rapidly increased and the market has been more volatile in recent years, the company realized the necessity for more robust and effective ALM reporting to help navigate evolving market conditions.
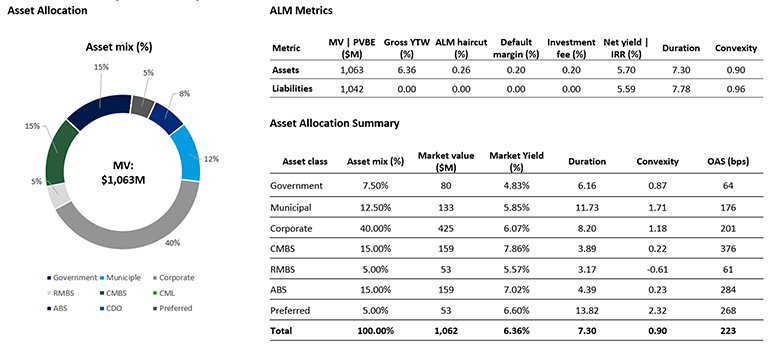
Exhibit 3 below illustrates XYZ’s current ALM report. It includes standard ALM metrics such as asset mix, market values, gross and net yields, interest rate duration and convexity, and spread.
Exhibit 3
ALM Position Report
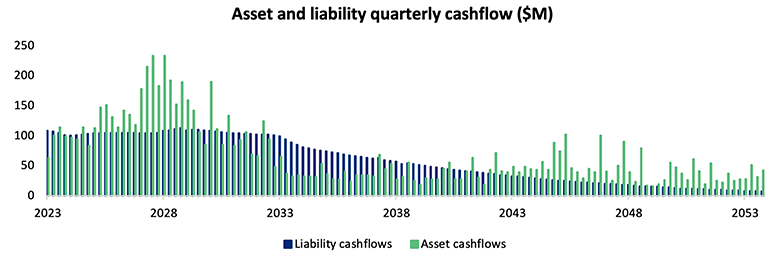
XYZ’s current reporting also includes asset and liability cashflow profiles. This provides insight into the timing and magnitude of projected asset and liability cashflows, enabling XYZ to proactively manage liquidity needs. (see Exhibit 4)
Exhibit 4
Asset and Liability Cashflow Profile
In recent years, the interest rate curve has been inverted and there is uncertainty around the future shape of the curve. XYZ incorporated key rate duration (KRD) to their ALM report to assess the sensitivity of assets and liabilities to individual interest rate tenors. This is important because there has been significant deviation of rate changes by tenors and future interest rate curve changes may not be parallel either. This allows XYZ to gain a more detailed understanding of duration mis-matches that may exist. (see Exhibit 5)
Exhibit 5
Key Rate Duration (KRD)
XYZ also implemented a risk-factor based attribution analysis that breaks down the asset and liability value changes into the common set of risk factors. As demonstrated in Exhibit 6 below, the main drivers of the change in net market value in this reporting period are interest rates and new business.
Exhibit 6
Risk-factor Based Attribution
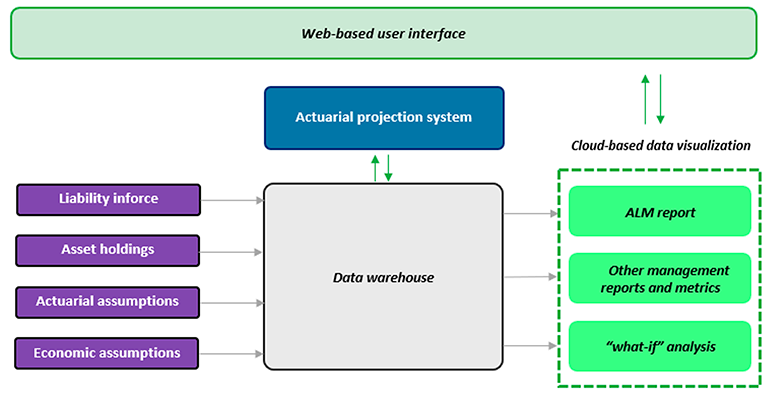
As part of the broader transformation initiative at XYZ, the ALM team worked with IT to implement the ALM dashboard in a data visualization tool and connect it to a cloud-based data warehouse. The data warehouse contains preprocessed and standardized liabilities, assets, assumptions, and other company data. The ALM team and senior management are granted access to a web-based portal from which they can access the pre-defined ALM reports, build custom reports, and drill down to more granular analytics and underlying data. Additionally, the system incorporates a trigger that sends an email notification to management when risk exposures approach or exceed limits. (see Exhibit 7)
Exhibit 7
ALM Projection Ecosystem
After all the enhancements made, the end-to-end ALM reporting time is reduced to four weeks. Management also has deeper understanding of their assets, liabilities, and risk-factors, which enables them to make more informed and timely decisions in a changing economic environment.
Statements of fact and opinions expressed herein are those of the individual authors and are not necessarily those of the Society of Actuaries, the newsletter editors, or the respective authors’ employers.

