The Battle to Transform the Actuarial Profession in South Africa: The University Frontline
By Lusani Mulaudzi
Expanding Horizons, June 2024

Editor’s Note/Content Warning: This article contains language that may be difficult for some readers. It includes apartheid redress categories for students that are based on the categorization of their parents’ race under apartheid.[1] They serve as proxies for an individual’s race. The editor is sensitive that in South Africa such categorization, even for redress purposes, stirs debate because it uses terms that are a product of apartheid and also established the basis under apartheid for then-legalized discrimination.[2] Reader discretion is advised.
| Disclaimer: At the Society of Actuaries (SOA), our goal is for all members and candidates to feel fully included by welcoming diverse perspectives. The SOA makes no endorsement or representation with regard to any content. |
According to the Actuarial Society of South Africa (ASSA) only 9 percent of its Fellows[3] are Black Africans, although Black people represent 80 percent of the South African population. In total, 24 percent of the Fellows are not white (and include multiracial and Indian students).[4] This highlights the extent of the challenge both the actuarial profession and the educational system of South Africa face in regard to promoting diversity.
Universities are instrumental in the transformation of a country’s skilled workforce to reflect the demographic profile of that country. The school system in South Africa struggles to produce the required quality and quantity of school leavers who are ready for university education. Dr. Nic Spaull observed that in international benchmarking tests, Grade 9 South African learners performed at a level that is two to three grades lower than learners in other middle-income countries.[5] This has led to universities collaborating with each other to develop ways to manage the crisis. In 2013, the Council on Higher Education (CHE) published a report detailing how extended degree[6] programs can improve graduation rates at universities.[7]
The University of Cape Town (UCT) has a long history of various types of academic development programs that were initially introduced in the 1980s to support Black students, who were historically excluded from studying at universities like UCT. The university’s actuarial program is one of the oldest actuarial departments in the country and has produced many actuaries over the years. An academic development extended program for actuarial students was introduced in 2010.[8] This program was registered with the Department of Higher Education as a plus-one-year degree—that is, as a five-year business science degree instead of the mainstream four-year business science degree. The degree also accommodates students with slightly lower entrance points based on their school results. The five-year degree follows a different curriculum in the first two years, with some of the regular first-year subjects conducted only in the second year and the Mathematics 1 course conducted over two years instead of one. The students in this program have access to a supportive community of dedicated lecturers, support staff members and mentors. In 2016 a four-year degree version was introduced that follows the same curriculum as the mainstream business science actuarial science degree except for the Statistics 1 course, which is conducted over the whole year instead of a semester.
Only students in certain apartheid redress categories, as defined by the university’s admission guidelines, can participate in the extended and augmented programs. For apartheid redress purposes, the South African applicants are categorized by the UCT according to the categorization of their parents’ race under apartheid. The redress categories serve as proxies for the applicant’s race; the UCT explains these four categories as follows:[9]
- Redress category 1: An applicant with at least one parent classified as Black under apartheid
- Redress category 2: An applicant with at least one parent classified as coloured (and the other not as Black) under apartheid
- Redress category 3: An applicant with at least one parent classified as Indian (and the other not as Black or coloured) under apartheid
- Redress category 4: An applicant with at least one parent classified as Chinese (and the other not as Black, coloured or Indian) under apartheid
The UTC classifications and terms for them are used throughout this article. Students self-declared their categories, and the analysis of performance is based on their categorizations. Note: “Coloured” previously was a term used by the South African government under apartheid to indicate a person of mixed white and Black/Asian ancestry. Despite the abolition of apartheid in 1991, the term is still used to define one of the four major race groups in South Africa.
In summary, there are three degree programs for actuarial students. One is the four-year mainstream program. The other two are academic development programs: one follows an extended curriculum over five years, and the other follows the four-year mainstream curriculum but extends the Statistics 1 course across a full year rather than one semester. Students in both of the academic development programs have access to a supportive community as described above. Students in the mainstream program have access to the university-wide support structures such as student wellness services, career services, tutors and lecturers. The focused tuition support for the academic development students is available mostly in the first and second academic years of study.
The psychosocial support that is provided to the students participating in these academic development programs should not be understated. Petersen and colleagues reported that psychosocial factors were responsible for 59 percent of the variance in the quality of the student’s adjustment to university.[10] Van der Bergh found that socioeconomic differentials have a significant impact on educational outcomes.[11] Also, a study by Anderson and others found that racial differences in performance persisted after the end of apartheid, that family background plays an important role and that the quality of the school one attends can affect earnings by as much as 25 percent. The academic development programs aim to mitigate these effects as much as possible.
For example, the Education Development Unit (EDU) that manages these programs hosts annual award ceremonies to honor student achievements. In the ceremonies, top achievers in various subjects are recognized and celebrated. Successful alumni are also invited back to share their stories with the current program participants. Over the years many participants have excelled and are now highly sought-after professionals. Although it is a challenge to measure the impact of a combination of interventions varying from subject-specific tuition and extended curriculum to mentorship in a supportive community on academic performance, it is possible to measure the overall impact.
Our study focuses on measuring the overall impact of these interventions for actuarial students by comparing the academic performance of students with and without these interventions. We are, however, unable to attribute performance to specific interventions and acknowledge that there may be other confounding factors that are not measurable. Strugnell and Ranchod used survival analysis to identify factors that have an influence on throughput rates in the UCT actuarial science program.[12] Their study concluded that race, EDU participation, National Benchmark Tests (NBT) Academic literacy results, NBT Mathematical literacy results and National Senior Certificate (NSC) Mathematics results have a significant impact on throughout rates for actuarial science students.
Although our study aims to measure the impact of the EDU interventions using cost-benefit analysis, this article focuses only on the analysis of student performance in the various programs over a period of eight years from 2010 through 2017.
Analysis of the Performance of the 2010–2017 Student Cohorts
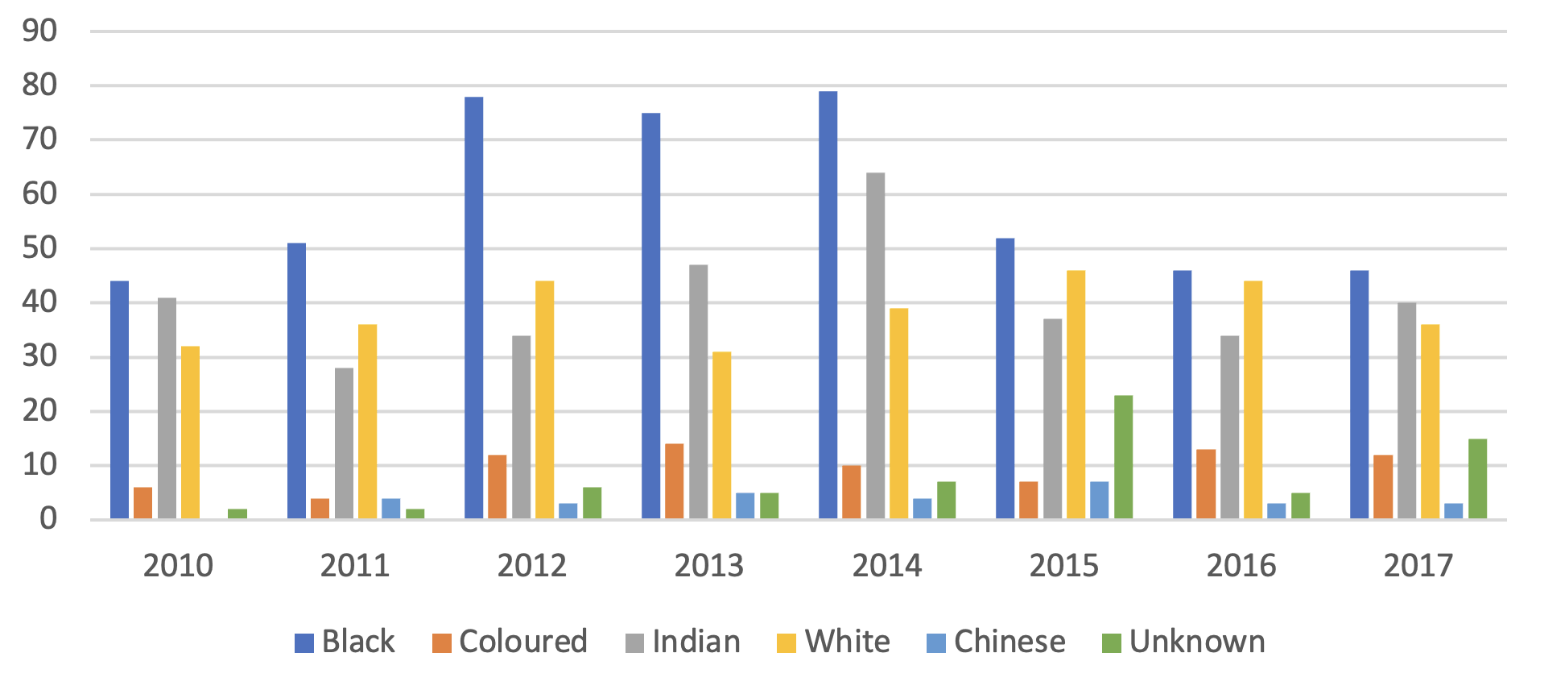
The need to monitor transformation efforts unfortunately leads to a continuation of racial categorization in South Africa. Figure 1 illustrates how the racial composition of the business science actuarial degree students has changed over the study period.
Figure 1
Business Science Actuarial Student Enrolments by Racial Group 2010–2017
Note: The categories are based on the categorization of their parents’ race under apartheid for redress purposes.
The enrolments of Black students increased sharply in 2012, remained stable until 2014 and then dropped off in 2015. The enrolments of white students remained relatively stable over the same period. The enrolments of Indian students peaked in 2014 and dropped off in 2015.
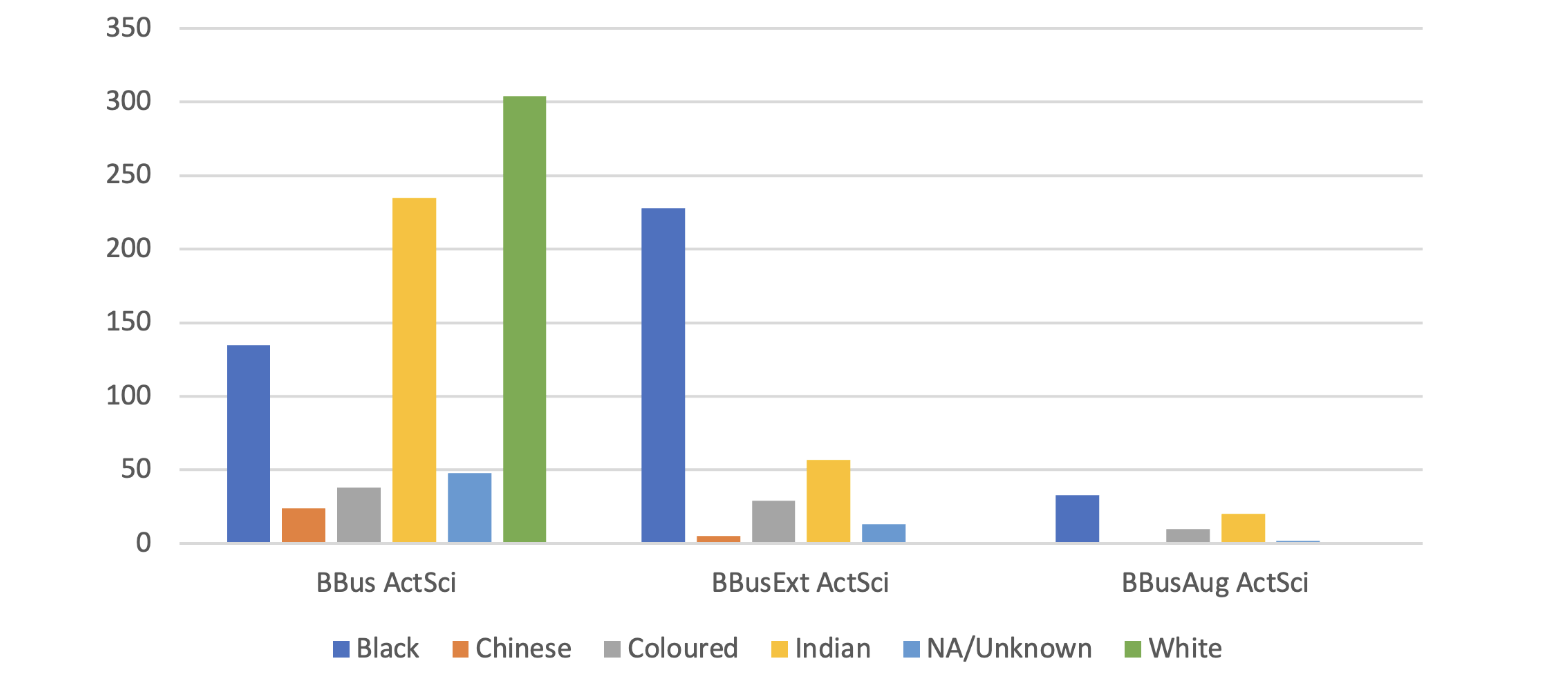
Based on figure 2, it is evident that the majority of Black students over this period were enrolled in the five-year extended program, whereas a majority of Indian students were enrolled in the four-year mainstream degree. Enrollments in the four-year augmented program appear to have commenced in 2016, hence the small numbers over the study period. The white students were all enrolled in the four-year mainstream program, as expected.
Figure 2
Total Student Enrollment by Race per Actuarial Program 2010–2017
Note: The categories are based on the categorization of their parents’ race under apartheid for redress purposes.
At the outset of their studies, students would ordinarily be interested to know what their chances are of graduating with an actuarial degree. In the figures below, graduation rates across the different racial groups and actuarial programs are examined.
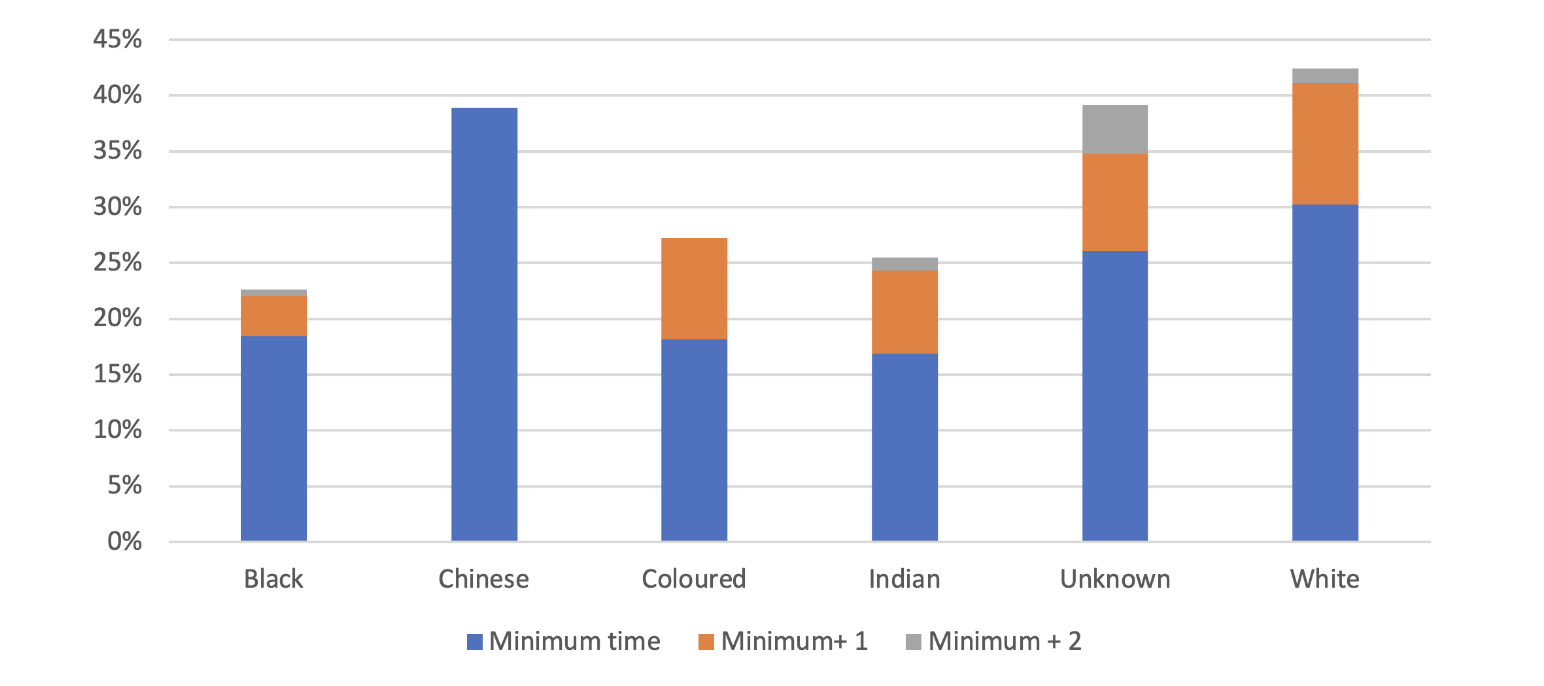
Figure 3 illustrates the graduation rates of the 2010–2017 cohorts of students who were enrolled in the four-year business science degree programs (both mainstream and augmented).
Figure 3
Graduation Rates for Business Science Actuarial Students 2010–2017
Note: The categories are based on the categorization of their parents’ race under apartheid for redress purposes.
Black students had the lowest overall graduation rate of students graduating with a business science actuarial degree in at least four years. Students of Chinese descent had the highest minimum time graduation rate, but they were a significantly small proportion of the cohorts. The unknown category is comprised of students that did not self-declare their race, but similarities between this category and the white students are evident. The white students had the highest overall graduation rate, including those students who took up to two additional years to graduate. A student enrolled in the business science actuarial degree during this period had, at best, a 42 percent chance of graduating with this degree; this number applied only to white students in this study. Chinese students had a 39 percent chance, and Indian students had a 25 percent chance. Students grouped under the coloured redress category had a 27 percent chance, while Black students had a 23 percent chance.
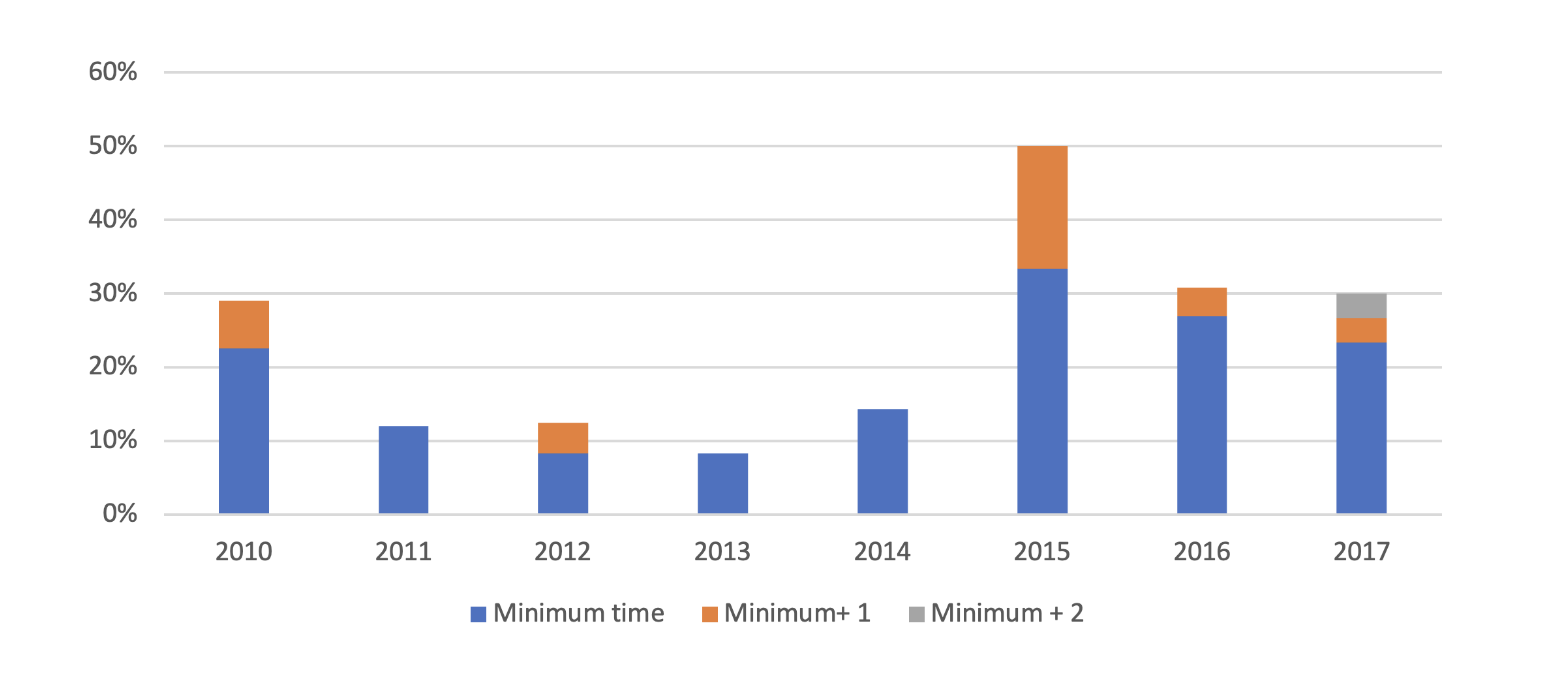
Figure 4 illustrates the graduation rates for cohorts of Black students over the period from 2010 through 2017. The objective of academic development initiatives is to improve the graduation rates of previously disadvantaged students (those whose parents were categorized under apartheid as Black, Indian or coloured).[13] An improvement in graduation rates over this period could indicate that the interventions made an impact.
Figure 4
Graduation Rates for Business Science Actuarial Black Students 2010–2017
The graduation rates dropped in 2011 and remained low until 2015. The sharp improvement in 2015 is evident, and subsequent cohorts also performed better than before 2015. The four-year augmented program was introduced in 2016 and may explain the obvious improvement. Whether this is due to improvements in the program or to attracting academically strong Black students into the four-year augmented program isn’t immediately clear. What emerges from examining Figures 1 and 4 is that the enrolments for Black students went down in 2015, and the graduation rates for the subsequent cohorts improved.
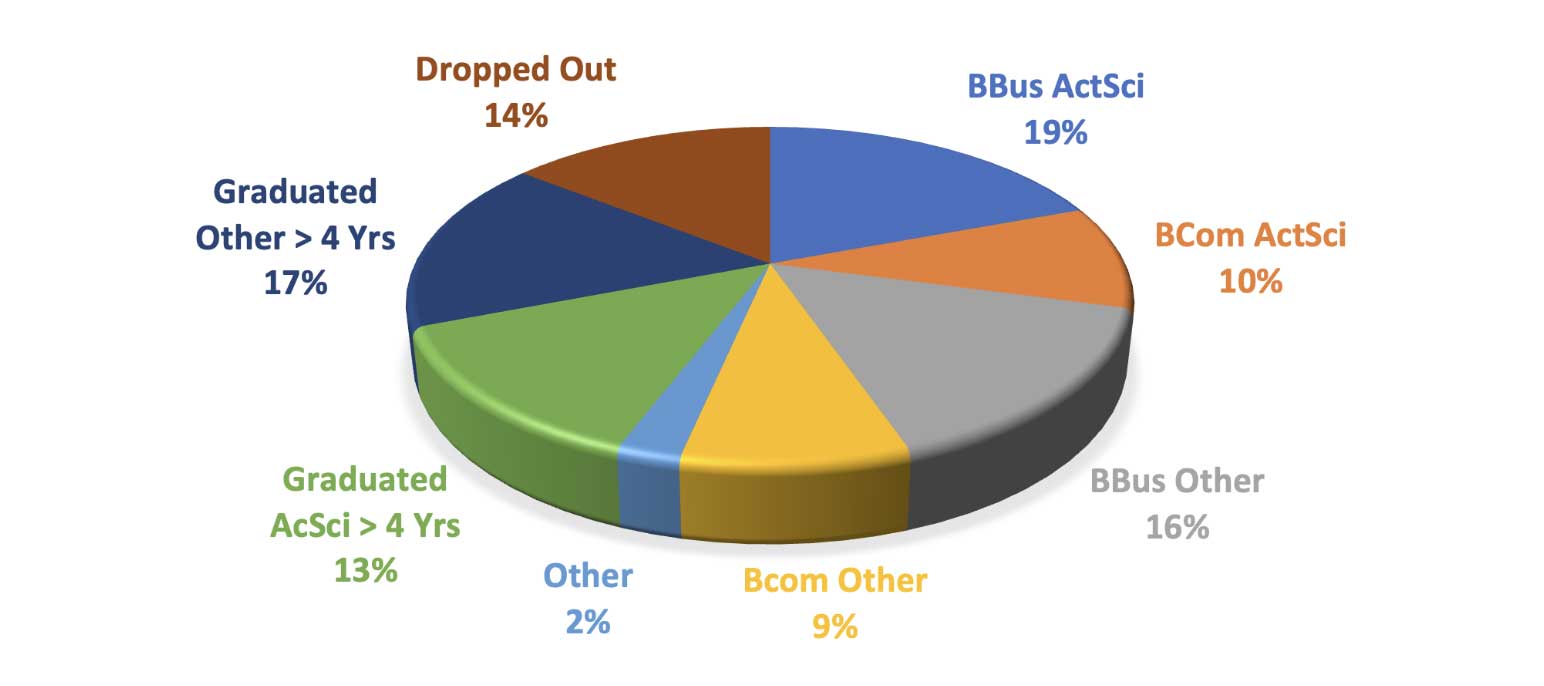
Figure 5 illustrates the outcomes for all students who commenced their studies in the business science actuarial mainstream program. Nineteen percent of the students who enrolled in the mainstream four-year business science actuarial program graduated in minimum time; 10 percent graduated with a three-year bachelor of commerce actuarial science degree (not included in the study as this degree does not have the same curriculum); and 15 percent with one of the other four-year business science degrees. Fourteen percent dropped out, although some of them were in good standing. The rest took longer to graduate in actuarial science and other degrees. Overall, 42 percent of those who commenced with a four-year business science actuarial program graduated with an actuarial science degree—either the four-year business science or three-year bachelor of commerce. This figure includes all races.
Figure 5
Exit Status for Business Science Actuarial (Mainstream) Students 2010–2017
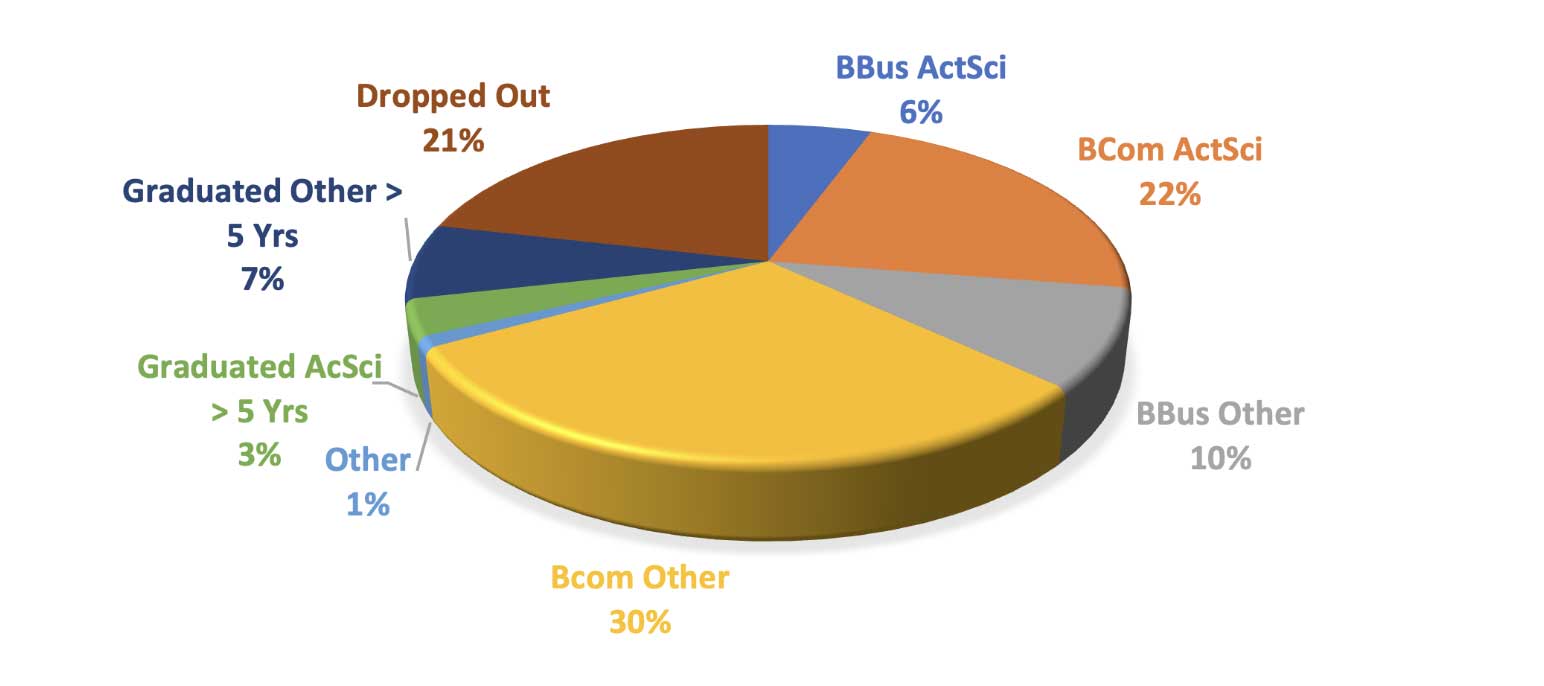
Figure 6 considers the same outcome measures for students enrolled in the five-year business science actuarial extended program. Only 6 percent of the students enrolled in this program obtained their degrees as planned. Twenty-two percent graduated with a bachelor of commerce actuarial science degree, 10 percent with one of the other business science degrees and 30 percent with one of the other bachelor of commerce degrees. Twenty-one percent dropped out for various reasons, and the rest took longer than five years to graduate. It is evident that the outcomes are worse compared to the mainstream program, even though more time was allocated to cover the same syllabus. This may indicate that admitting academically weaker students to the actuarial science degrees is unlikely to yield positive results.
Figure 6
Exit Status for Five-Year Business Science Actuarial Extended Program Students 2010–2017
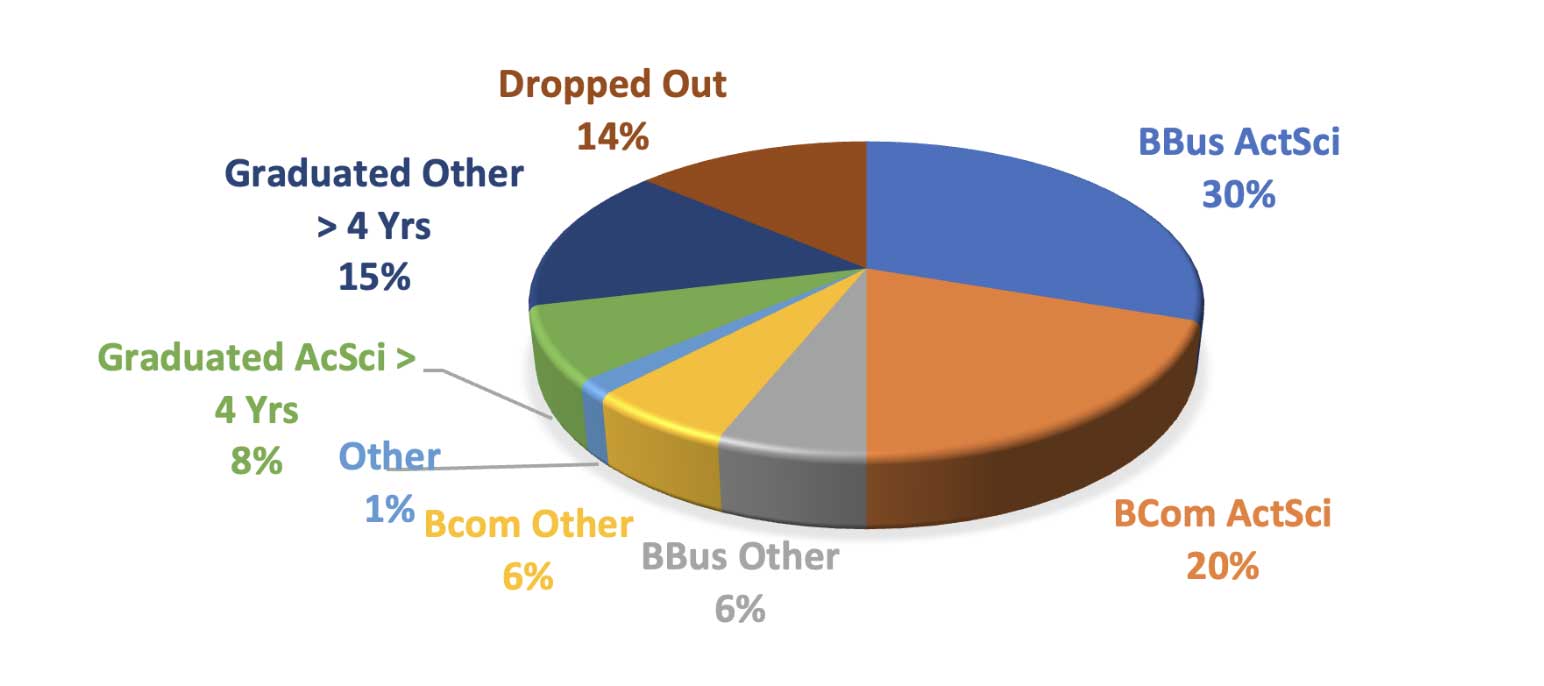
The augmented four-year program has the same admission requirements as the mainstream program but was only open for previously disadvantaged students. Figure 7 illustrates the outcomes for students enrolled in the four-year augmented program.
Figure 7
Exit Status for Four-Year Augmented Business Science Actuarial Augmented Program Students 2010–2017
The graduation rate in minimum time was 30 percent and therefore much higher than that of the mainstream and extended programs. The dropout rate was about the same as that of the mainstream program. Many more of these students graduated with an actuarial science degree. Based on these results, there is a strong indication that the augmented program yielded better results than both the mainstream and the extended programs.
The augmented program appears to have been a much better transformation tool than the extended program based on the observed results during its short two-year existence within the investigation period.
To further understand the impact of the augmented program, the pre-university results of the group of students enrolled in this program were compared to the results of similar students enrolled in the other programs. Black students in the augmented program had higher National Benchmarking Test (NBT) Mathematics results compared to Black students enrolled in the mainstream program. Indian students had higher NBT Quantitative Literacy scores than their mainstream program counterparts. This may indicate that the augmented program attracted relatively stronger candidates amongst the previously disadvantaged students.
Black and Indian students in the augmented program performed better in actuarial risk management (final year major) than their counterparts in the mainstream program. The augmented program is evidently not a deficit program,[14] unlike the extended program, which attracted relatively weaker students.
With a success rate of less than 50 percent, it can be argued that the majority of all students enrolling in actuarial science need some kind of additional assistance. Only 19 percent of the mainstream students and 30 percent of the augmented students did not need any extra time to obtain their actuarial degrees. So, in reality, between 70 percent and 80 percent of the students enrolled in the four-year business science actuarial degree ultimately extended their degree or left it.
Conclusion
Over 70 percent of the business science actuarial enrollments in the period from 2010 through 2017 comprised previously disadvantaged students. This indicates the value of the UCT actuarial section in the efforts to transform the actuarial profession in South Africa.
The graduation rates of actuarial students whose parents were categorized as Black, Indian and coloured under apartheid are at least 15 percent lower than the graduation rates of white actuarial students. This graduation rate gap reduces the upfront demographic profile progress that has been made.
The improvement in the graduation rate of Black actuarial students over this same period is evident and may be attributed to the introduction of the augmented program.
The majority of students enrolling in actuarial science ended up as non-actuarial science graduates or dropping out. It is, however, important to point out that some of the students who dropped out were in good standing and may thus have enrolled in other universities and eventually graduated. Also, some of the non-actuarial graduates do continue to write actuarial exams and eventually qualify as actuaries.
The actuarial transformation pipeline improved over this period but at a slower pace than required to meaningfully transform the actuarial profession in South Africa. For the actuarial profession to become more diverse, the graduation rates of previously disadvantaged students will need to be at least the same as those of white students.
Given the challenges in the educational system in South Africa, is this objective achievable? This is a question that university actuarial departments will need to answer.
Next Steps
This article covers a portion of a study that is being undertaken to assess the cost-benefit value of the EDU interventions in the actuarial program at the University of Cape Town. The retrospective analysis of student performance will be used to develop a cost-benefit model for 2030. Other aspects of performance such as subject-specific performance and regression analysis to identify key factors are part of the comprehensive study.
Statements of fact and opinions expressed herein are those of the individual authors and are not necessarily those of the Society of Actuaries, the editors, or the respective authors’ employers.
Lusani Mulaudzi, FASSA, is head of section at the University of Cape Town. Lusani can be reached at lusani.mulaudzi@uct.ac.za.

