The Application of Data Blending to Resolve Unrelated Dimensions: A Tableau Use-Case for Calculating Per Member Per Year
By Joshua Sigrist
Health Watch, May 2023

Background
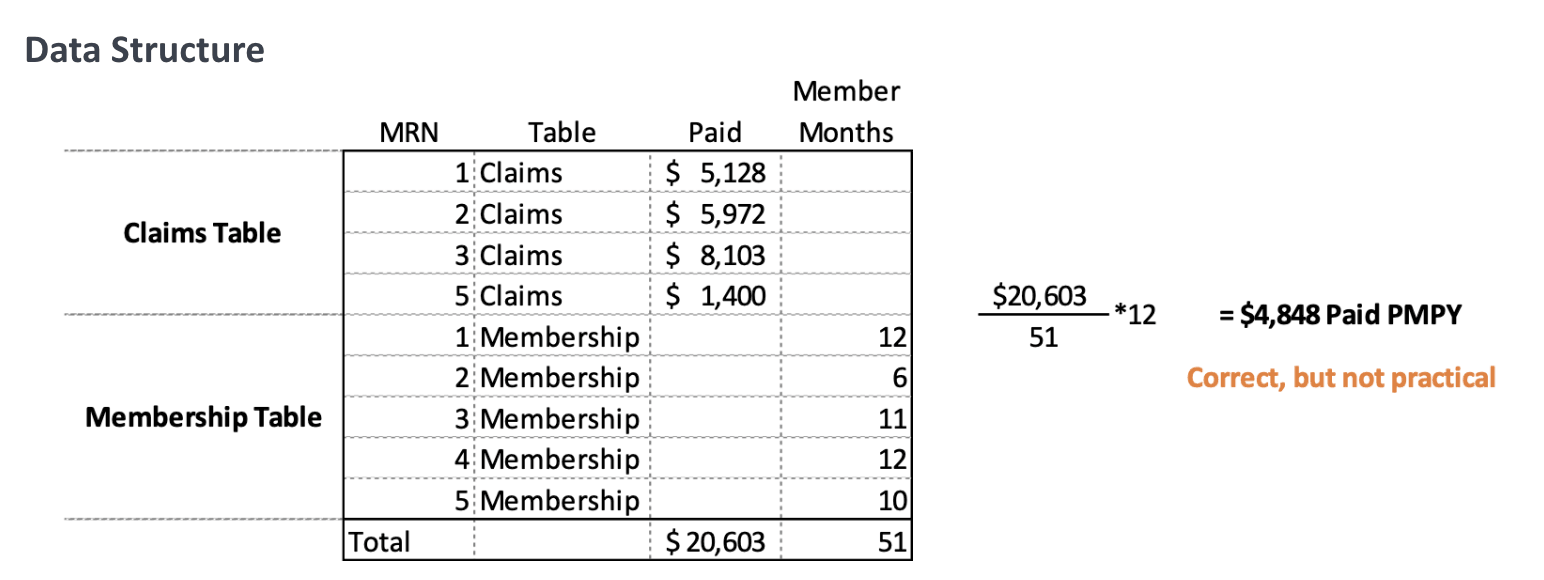
The Centers for Medicare & Medicaid Services (CMS) provides accountable care organizations (ACOs) with monthly claims data (referred to as claim and claim line feed, or CCLF), which includes member information with respect to their visit with their medical provider, as well as information that pertains to their eligibility in the ACO program. Through the extract, transform and load (ETL) process, the CCLF data may be parsed out into two tables: Membership and Claims. Both tables contain identical information, except for claim-specific detail such as the type of service (inpatient, outpatient, professional, etc.); paid dollars; units (discharges, days, visits, procedures, etc.) and member months, where each member is given a 1 or a 0 for each month of their eligibility in the program. The most granular level of detail in the Membership table is medical record number (Medicare beneficiary identifier, or MBI) and month. The per member per year (PMPY) formula, in Tableau format, is as follows:
Note: This equation uses “dot notation” to identify the table being referenced. Normally this is only applied to fields from a secondary data source. However, in this case it is applied to both data sources for ease of understanding.
Problem Statement
When attempting to calculate PMPY at various levels of detail using both the Claims and Membership tables, the problem exists where the member month count is being filtered, joined or otherwise associated programmatically in an undesirable way when looking at specific levels of detail that exist only in the Claims table. This is commonly found when claims data for a member are not present at a level of detail that causes the denominator of the PMPY calculation to produce inaccurate and understated results. Existing literature has described this phenomenon as “unrelated dimensions,” or dimensions that are unrelated to a measure group (for example, see IgnoreUnrelatedDimensions in Microsoft’s SSAS documentation,[1] or perform a Google search for other examples). In our case, the set of dimensions needed to bring in the member months measure value (denominator) appropriately is not related to the Claims table, for the purpose of calculating PMPY. Note that there is a point at which the more granular the level of detail is, the less value the PMPY calculation adds to the analysis.
Requirements
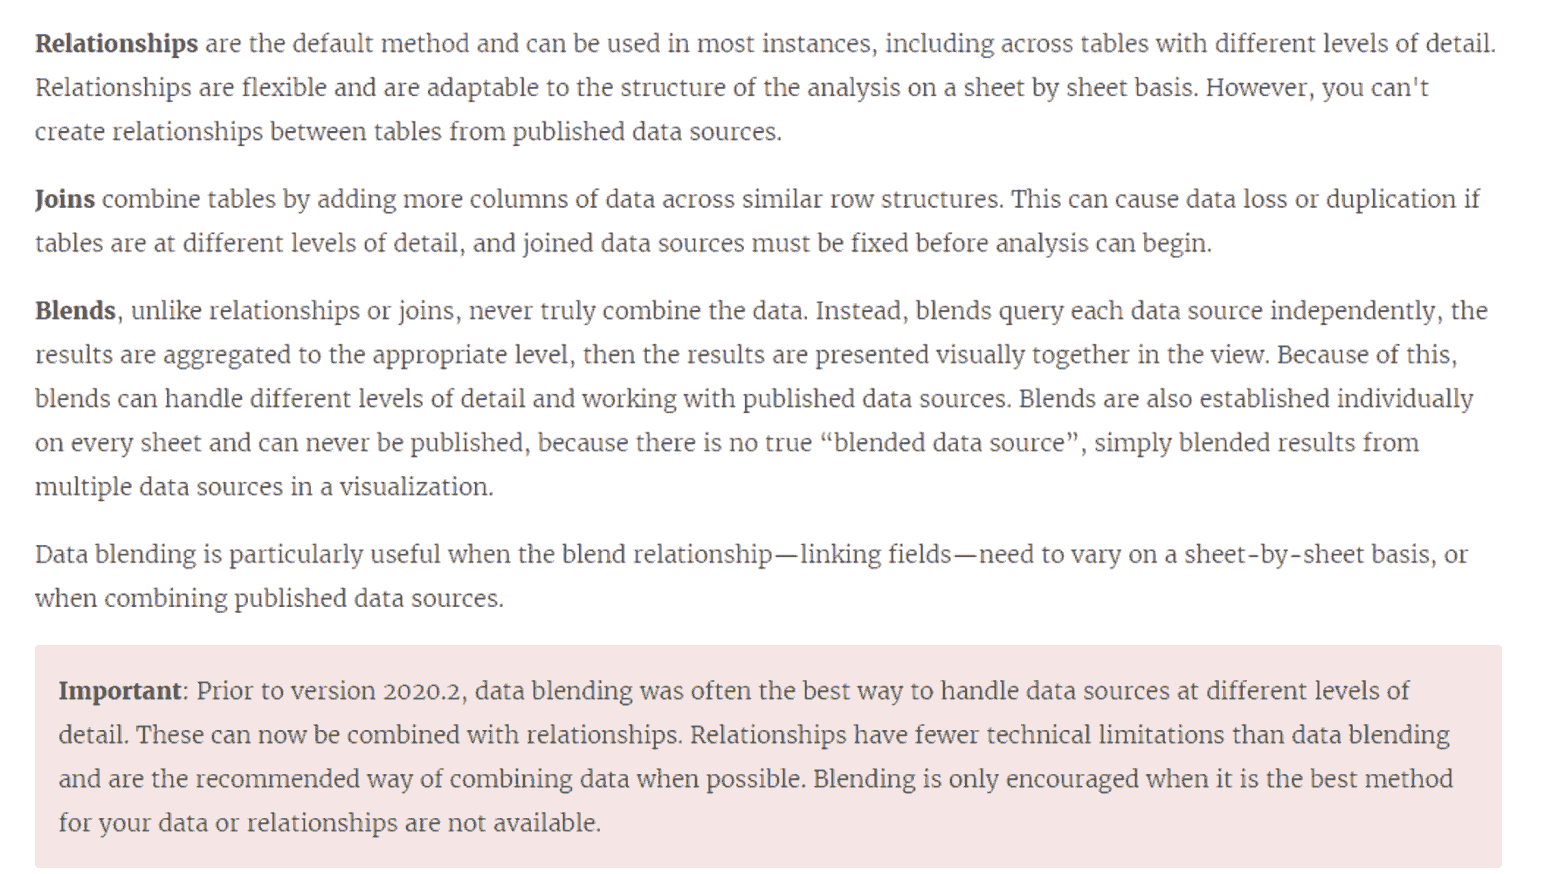
The resulting product must be able to display PMPY at all levels of detail possible and be able to toggle between PMPY and counts (nonrates). Filtering needs to allow for various levels of detail while maintaining consistency in member months in the denominator of the PMPY calculation. For example, when a service type is selected, the denominator (member months) needs to remain unchanged to keep the PMPY calculation accurate. The same is true with all common dimensions between both the Claims and Membership tables. Tableau offers several ways to combine data: relationships, joins and blends (Figure 1). Tableau Desktop version 2022.1.1 was used to create the figures in this article.
Figure 1
Tableau’s Methods for Combining Data
Source: Tableau Software, “Blend Your Data,” n.d., https://help.tableau.com/current/pro/desktop/en-us/multiple_connections.htm.
Attempts
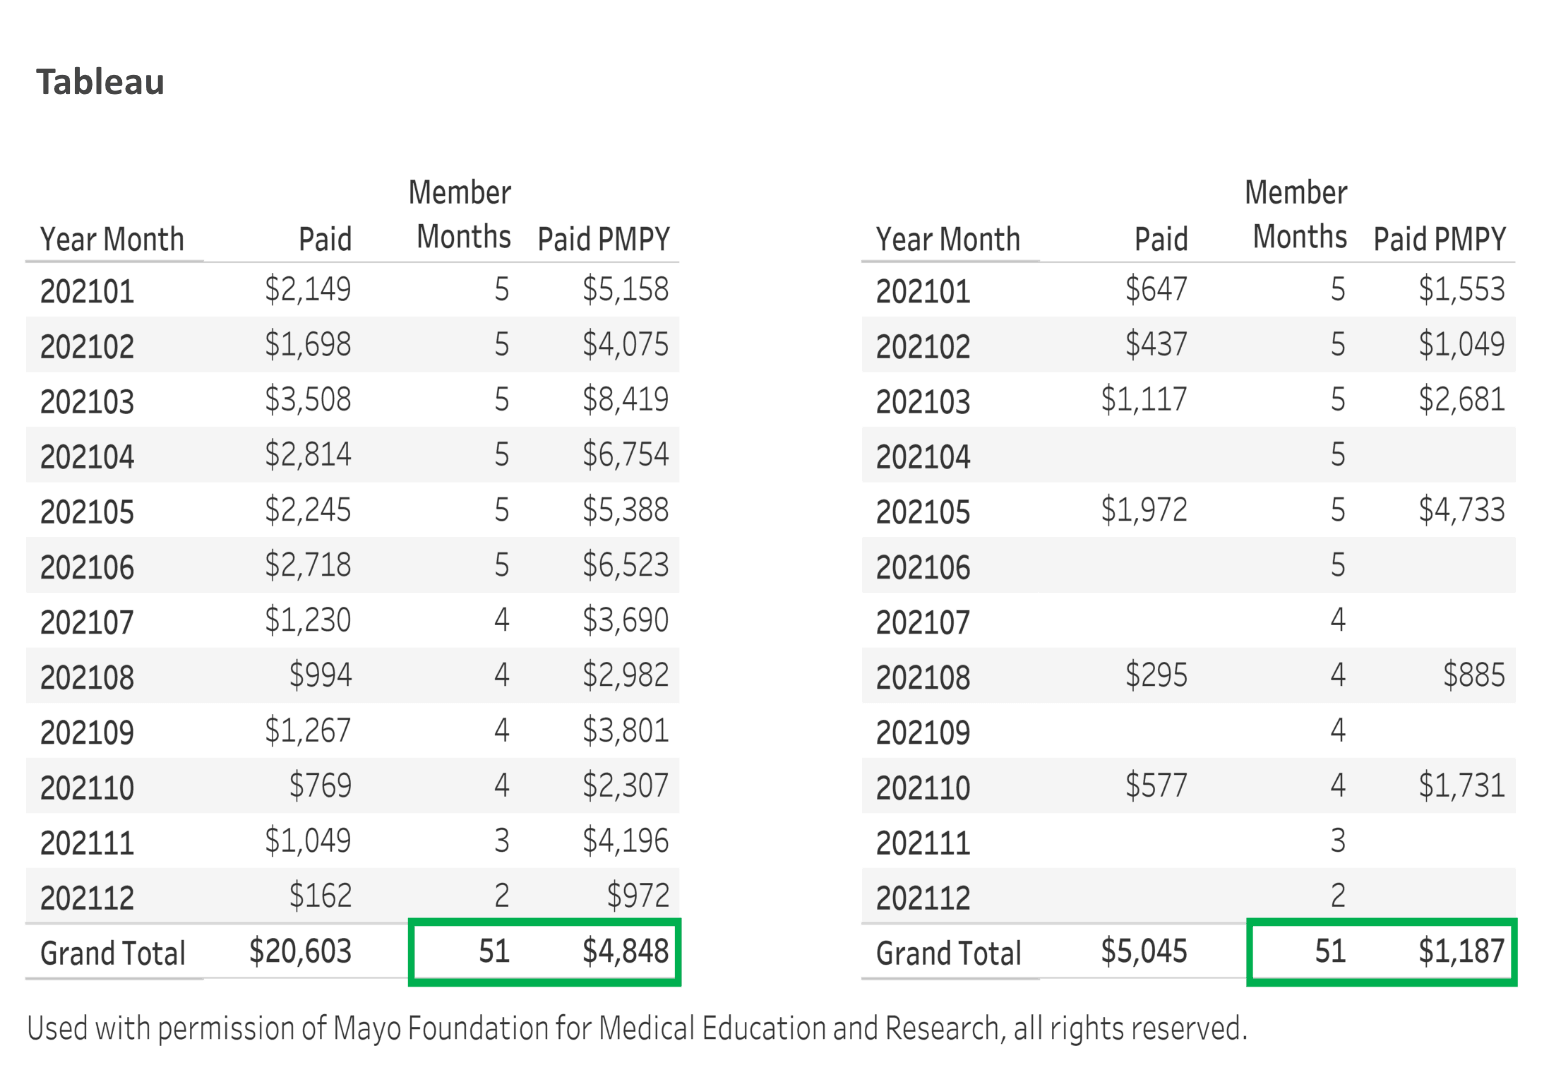
At first it might seem reasonable to assume that a left join onto Claims (Figure 2) will do the trick, and that would be true, but only to a degree. Given that reporting is claims-based, it makes sense to think that the left table should be the Claims table. Filtering on fields that exist in both tables and are available from month to month will yield accurate results, but as you increase granularity, the data elements from the Claims table will depend on whether a single patient was seen by a provider at the specified level of detail needed to produce accurate member month results. No claims results in no (or null) member months.
Figure 2
Left Join to Claims
This approach works with no filtering or when there are higher levels of filtering, such as in instances where there is likely to be a claim match between both the Claims table and the Membership table. A good example is filtering on year and/or month for a particular member, where that information will always be available in both tables. Any additional filtering will likely produce inaccurate results.
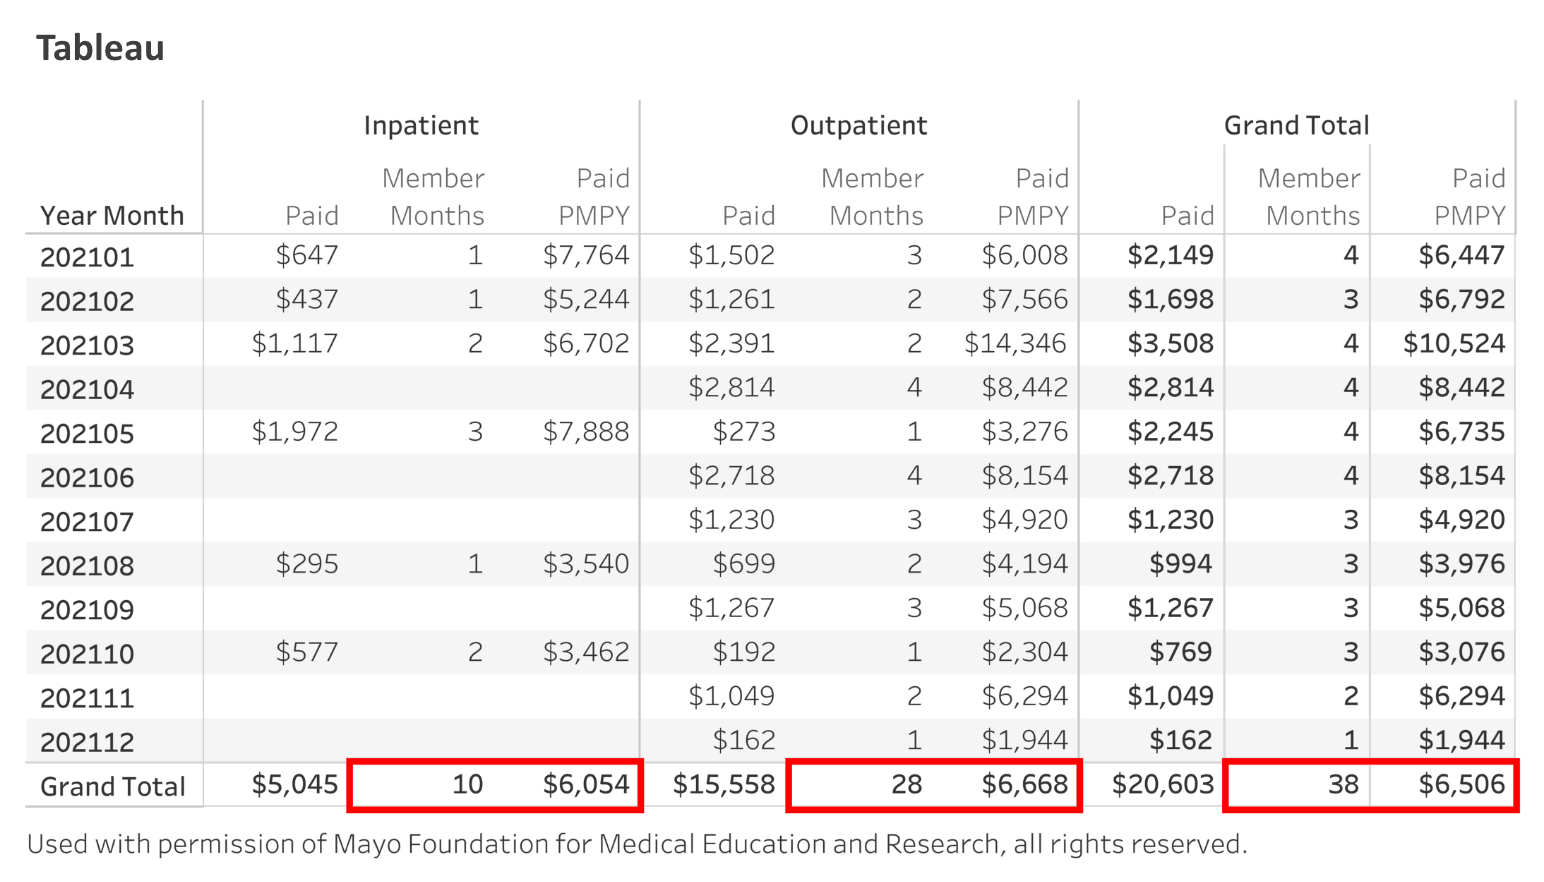
Since a left join to Claims does not do the trick, you might try a left join to Membership instead (Figure 3). While this approach resolves the question of which data source drives the data, it does not quite get us there either. Again, we have results that appear to be accurate at first, until we reach a level of detail where the denominator falls apart. In this case, a one-to-many relationship is created, where an asterisk appears in the calculated results.
Figure 3
Left Join to Membership
While this approach does work for PMPY calculations, it does not work when filtering on fields such as service, service rollup or any field in the Claims table that does not exist in the Membership table.
Another attempt can be made by using a union (Figure 4). While this approach works great in both Excel and Tableau, particularly for ad hoc analyses, it does not bode well for the user experience. To achieve the desired results, any filter on a dimension that does not exist in the Membership table requires the additional filter value of “blank” to be selected at all times. While Tableau has some creative ways to work around obstacles like these, there is currently (as of this writing) no approach to resolving the problem. In addition to filtering, other calculations become difficult to perform with this option.
Figure 4
Union
Unions are great; however, from a user perspective, having to always select “null” as an option is not an elegant solution and does not meet customer expectations from an ease-of-use perspective. There are other challenges, such as the inability to show the Type of Service on the columns shelf (because doing so would prevent the PMPY value from showing in the table), except for in the Grand Total row.
Solution
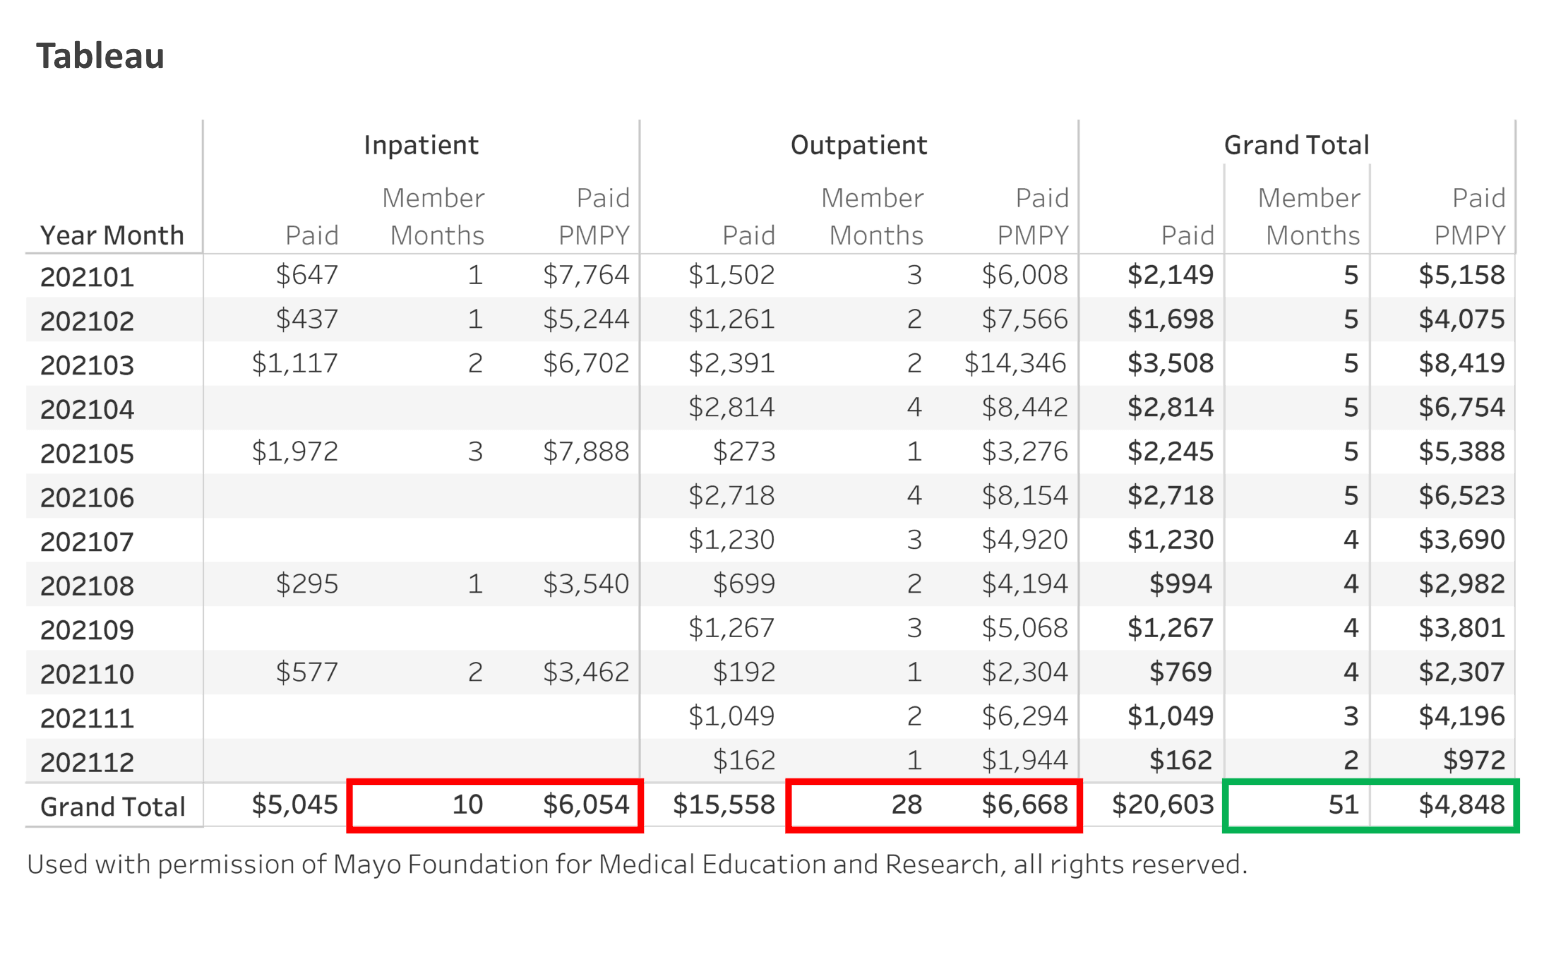
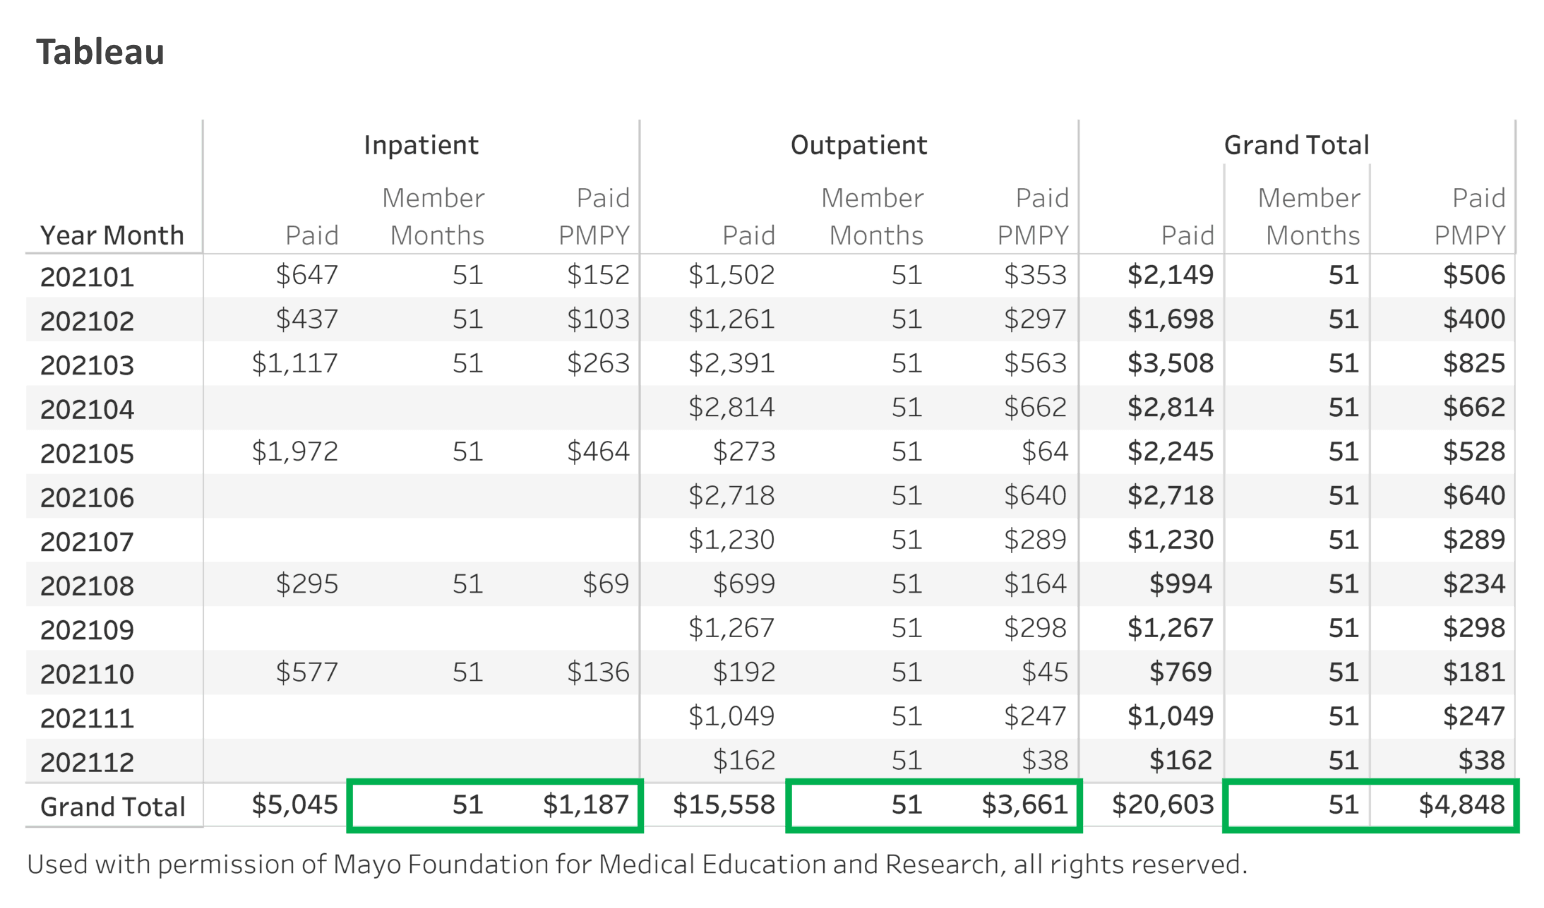
While the preceding three approaches are just a few of the many that can be explored, the solution that produces the most accurate and reliable results is the blended data approach (Figure 5). At first it might seem like a bad idea to use an approach that Tableau no longer recommends as the best way to handle data sources at different levels of detail. In this case, it works out well, and from the description used to explain blending, it is not too surprising to see why it works:
Blends, unlike relationships or joins, never truly combine the data. Instead, blends query each data source independently, the results are aggregated to the appropriate level, then the results are presented visually together in the view. Because of this, blends can handle different levels of detail […]. Blends are also established individually on every sheet […], because there is no true “blended data source”, simply blended results from multiple data sources in a visualization. Data blending is particularly useful when the blend relationship—linking fields—need to vary on a sheet-by-sheet basis, or when combining published data sources.[2]
When blending the two data sources, in this case using the Claims table as the primary data source and the Membership table as the secondary data source, the Claims table is still the primary table. The Membership table is then used as a “lookup” table from the Claims table, by linking only the fields that are necessary to retrieve the desired results from the Membership table. Since the tables are not joined, what is shown are the aggregated results of each table at the specified (filtered) level of detail. So, for example, if the level of detail were March 2021, with transplant as the type of service, and there were no claims for that month, the numerator would be zero, but the denominator would be the correct member months for that month and year. The results depend on the correct application of linking dimensions on the secondary (blended) table. Experience with this approach has shown that the PMPY results are accurate at nearly every level, if not all. However, it is important to keep in mind that the value of the PMPY formula diminishes as the data become more granular.
As a word of caution, there have been reported incidents of links becoming undone, which is likely the result of intended behavior in Tableau, where the software determines if a link is appropriate based on common field names, as well as other factors, and automatically toggles the link(s) on or off. To manage that better, a caption can be used as a reminder of which link(s) should be on or off, and under what circumstances. This is also a good way to keep yourself from feeling confused between your initial setup and what Tableau did as a result of additional changes to the view.
Figure 5
Blending
Note: A working Tableau file containing all of the figures may be obtained by contacting the author at the email address provided below.
Example
The following is a high-level example outline of the blended data approach.
- Add the Claims table as a new data connection.
- Add the Membership table as a new data connection.
- In the Claims data source, create the following calculated fields:

- On a new sheet, build a table and validate the results to ensure that the calculations are correct and the appropriate relationship links are activated.
- On every visual, determine the appropriate combination of activated relationship links to get accurate results and document the combination in the worksheet’s caption.
- This is helpful in determining if a link becomes unchecked due to human interaction, human error or Tableau's assumptions that the link should be unchecked. Sometimes it is expected that Tableau should uncheck a link automatically, only if the dimension becomes present in the view as part of a selection, such as the expansion of a hierarchy. Otherwise, Tableau may make undesired changes. This behavior is not documented by Tableau as of this writing, but it is a known issue.
- If done correctly, the member month values should not change when selecting dimension values from the Claims table that are not in the Membership table.
Conclusion
In the absence of a medical claim, such as when no patients present for a specific type of medical service (transplants, for example), no claims are generated for that service, and the numerator of the PMPY calculation becomes zero. Without Tableau's blending capabilities, that zero in the numerator would skew the results of the PMPY formula, and we would not be able to generate the right PMPY at various levels of detail.
Acknowledgments
This is not an exhaustive list of approaches to the problem, as there would be too many to include (hundreds, in fact). Those covered in this article are the ones that seemed to make the most sense for a first attempt, though naturally that can be debated. The level of detail covered is not as granular as it could be because the steps involved would result in a much longer paper. That certainly could be helpful, but it is beyond the scope of the solution. There are also ways to structure the data so that more than one table is used or padding of missing claims data can fill in the gaps; however, none of the approaches attempted worked as a solution. Further exploration could be done there as well.
To my colleagues on the Actuarial Analytics team at Mayo Clinic, thank you for your shared expertise, support and encouragement.
Statements of fact and opinions expressed herein are those of the individual authors and are not necessarily those of the Society of Actuaries, the editors, or the respective authors’ employers.
Joshua Sigrist is a business intelligence manager at Mayo Clinic. Joshua can be reached at sigrist.joshua@mayo.edu.


