Results of the 2020 SOA Life Reinsurance Survey
By Anthony Ferraro and Joe Lario
Reinsurance News, July 2021

In 2020, individual life recurring new business volumes increased 12 percent in the U.S. and 1 percent in Canada over the same time period.
Group recurring in-force premiums increased by 3 percent in the U.S. in 2020, while premiums increased 13 percent in Canada over the same time period. Table 1 summarizes the most recent results from the 2020 SOA Life Reinsurance Survey.
Table 1
Reinsurance Landscape
About the Survey
The SOA Life Reinsurance Survey is an annual survey that exhibits individual and group life data from U.S. and Canadian life reinsurers. Survey results are based on financial information self-reported by reinsurance entities and include new business production and in-force figures, with reinsurance broken into the following categories:
- Recurring reinsurance: Conventional reinsurance covering an insurance policy with an issue date in the year in which it was reinsured. For purposes of this survey, this refers to an insurance policy issued and reinsured in 2020.
- Portfolio reinsurance: Reinsurance covering an insurance policy with an issue date in a year prior to the year in which it was reinsured or financial reinsurance. One example of portfolio reinsurance would be a group of policies issued during the period 2005–2006 but reinsured in 2020.
- Retrocession reinsurance: Reinsurance not directly written by the ceding company. Since the business usually comes from a reinsurer, this can be thought of as “reinsurance of reinsurance.”
Individual life results are based on net amount at risk, while the group life results are based on premium.
The figures are quoted in the currency of origin with U.S. business provided in USD and Canadian business provided in CAD.
While we reach out to all of the professional life reinsurers in North America, please note that there may be companies that did not respond to the survey and so are not included. For the second year, RMA has been included in the study. RMA represents Korean Re, Toa Re and other reinsurers.
The remainder of this article discusses this year’s results in more detail and looks at overall life reinsurance trends. We will begin by looking at the results for the U.S. individual life market.
United States—Individual Life
Recurring New Business
Recurring individual life new business recorded an increase in production for the fifth year in a row after a prolonged period of decreases. Compared to 2019, U.S. recurring new business rose nearly 12 percent from $535 billion to $598 billion in 2020. Contributing factors for the increase include:
- Overall cession rates have increased from an estimated 30 percent to 32 percent on new business.
- Continued growth in accelerated underwriting programs and expansion of face amounts on these programs. These factors elicit support from reinsurers in program development and risk sharing.
- Strong growth in market revenues (15 percent) from Direct distribution[1] necessitating reinsurer support in navigating the risks associated with this channel.
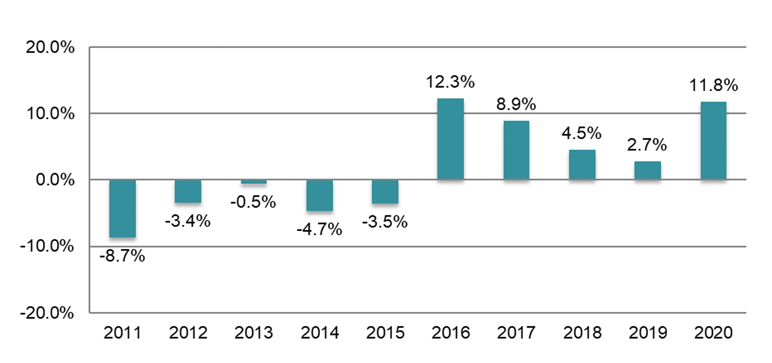
Figure 1 shows the annual percentage change in U.S. recurring new business production over the last 10 years, illustrating sustained upward trends over the past five years. Since 2015 individual life recurring new business has grown at a compound annual growth rate (CAGR) of 8 percent.
Figure 1
U.S. Percentage Change in Recurring New Business 2011–2020
In 2020, 83 percent of recurring new business production was yearly renewable term or YRT and 17 percent was coinsurance, in line with prior years.
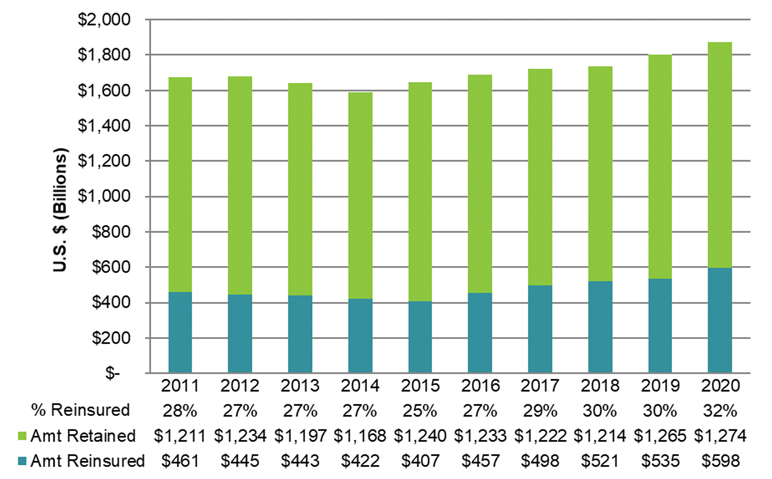
To estimate an overall cession rate for the life reinsurance industry, we compare new direct life sales to new recurring reinsurance production. According to LIMRA,[2] individual life insurance sales increased 4 percent in 2020 based on face amount. Taking these results together with the life reinsurance production levels results in an estimated cession rate for the industry of 32 percent for 2020. As seen in Figure 2, the estimated cession rate has increased steadily from 25 percent in 2015 to 32 percent in 2020, representing an increase in traditional risk sharing in recent years.
Figure 2
U.S. Individual Life Insurance Sales (Face Amount)
The top five companies by market share in the U.S. reinsurance market represent 82 percent of 2020 market share as compared to 86 percent last year (see Table 2). Swiss Re led all reinsurers in recurring individual life new business. In 2020, Swiss Re reported $126 billion of recurring business, a 19 percent increase from 2019, resulting in a 21 percent market share. The next three largest reinsurers by market share are Munich Re (19 percent, $111B recurring), RGA (17 percent, $104B) and SCOR (16 percent, $98B). Seven reinsurers reported increases in recurring new business volumes versus 2019.
Table 2
U.S. Recurring Individual Life Volume ($ billions USD)
Portfolio New Business
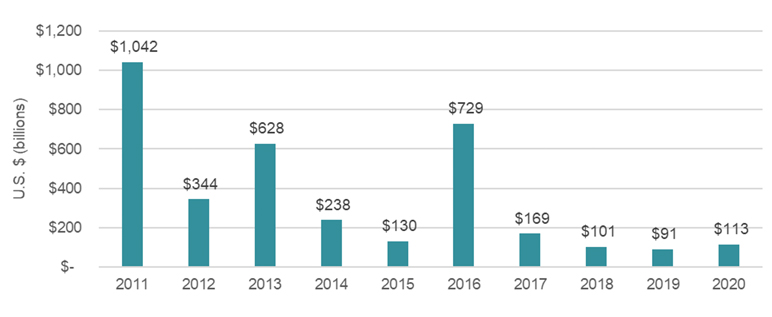
For survey purposes, portfolio reinsurance includes in-force blocks of business and financial reinsurance. As a result, there are often large fluctuations from year to year in reported portfolio results, and 2020 was no exception. New portfolio business increased from $91 billion in 2019 to $113 billion in 2020. Munich Re accounts for $56 billion (49 percent) of the 2020 portfolio new business followed by Swiss Re at $50 billion (44 percent) and Hannover with $4.5 billion (4 percent). There are three other companies reporting portfolio new business in 2020 accounting for $2.6 billion (2 percent).
Figure 3 illustrates the portfolio new business written over the last 10 years and the volatility of the results. As reported previously, the large spikes in 2011 and 2013 were the result of mergers and acquisitions within the life reinsurance industry, and 2016 featured a large in-force transaction.
Figure 3
U.S. Portfolio Business Trend
Retrocession
Retrocession new business volumes are considerably smaller than recurring new business and portfolio new business volumes. From 2005 to 2015, retrocession production in the U.S. had been on a downswing, dropping from $43 billion in 2005 to $5 billion in 2015. Following an uptick in 2016 to $8 billion, retrocession new business has remained flat through 2020. The primary retrocessionaires in 2020 (unchanged from 2019) were Berkshire Hathaway Group, Equitable and Pacific Life.
Canada—Individual Life
Now we will examine the results for the Canadian individual life market.
Recurring New Business
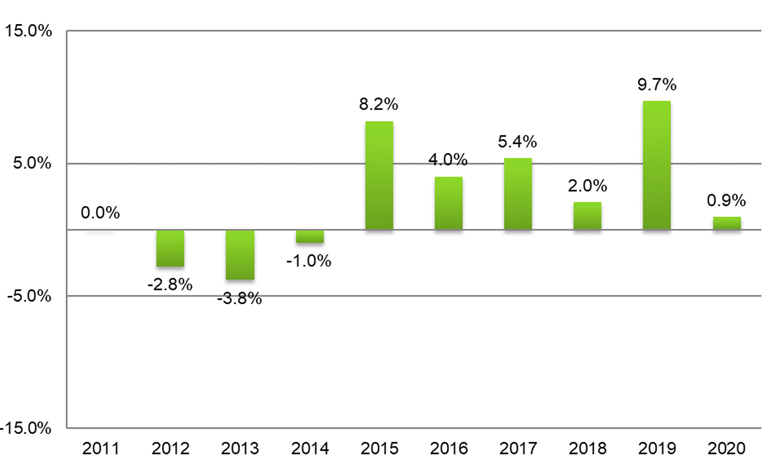
Recurring individual life new business in Canada ticked upward for the sixth consecutive year. Reported recurring new business totaled $190 billion in 2020 which is a 1 percent increase over 2019. Figure 4 shows the annual percentage change in recurring new business over the last 10 years. Since 2014, recurring new business in Canada has grown at a 5 percent CAGR after a period of minimal growth and declines.
Figure 4
Canadian Percentage Change in Recurring New Business 2011–2020
According to LIMRA, Canadian direct individual life sales, on a face amount basis, increased by 6 percent in 2020 compared to 2019.[3] This growth was driven by Term sales, which makes up 75 percent of face amounts and increased 8 percent on a face amount basis in 2020. Despite the increase in face amount, 2020 premium decreased by 2 percent. The decrease is driven by Whole Life policies which saw a 4 percent decrease in annualized premium and makes up 60 percent of total premiums. Limited underwriting support services (e.g., labs) due to COVID-19 reduced overall individual life sales in Q2 and Q3, although there was a bounceback in Q4.
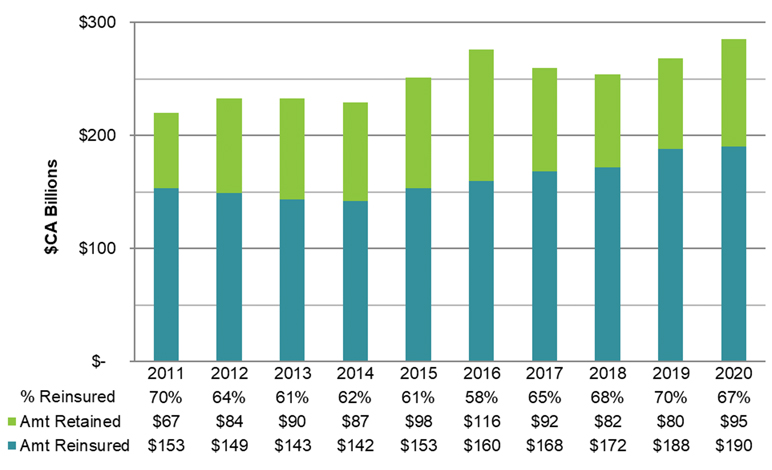
The estimated cession rate for 2020, which is based on a comparison of direct life sales to recurring reinsurance volumes, dropped slightly from 70 percent to 67 percent. Canadian cession rates are much higher than those in the U.S.
Figure 5
Canadian Individual Life Insurance Sales (Face Amount)
In terms of market share, the top three life reinsurers in the Canadian market remain the same as 2019 which are Munich Re, RGA and Partner Re. In 2020, they collectively represent 70 percent market share. Munich Re topped recurring new business writers reporting $49 billion, despite a 9 percent decrease over 2019. RGA followed with $48 billion (4 percent increase from 2019) and Partner Re rounded out the top three with a reported $36 billion (11 percent increase from 2019).
Of the eight reinsurers reporting material volumes to the survey, four reported increases in recurring new business volumes from 2019 to 2020. Table 3 summarizes assumed volumes and market share by reinsurer and compares 2020 and 2019 results.
Table 3
Canada Recurring Individual Life Volume ($ billions CAD)
Portfolio New Business
Hannover, Swiss Re and Munich Re reported material portfolio new business for 2020. Hannover accounted for $18 billion of the $21 billion reported.
Retrocession
Retrocession business in Canada is considerably smaller than recurring new business and portfolio business. Canadian retrocessionaires were Pacific Life and Berkshire Hathaway. Pacific Life led the retrocessionaires with $2.5 billion, followed by Berkshire Hathaway ($2.0 billion). Overall, the retrocession market in Canada decreased from $5.9 billion in 2019 to $4.5 billion in 2020.
United States—Group Life
The next section discusses the group insurance results for the U.S.
U.S. group life reinsurers reported over $8.3 billion of in-force premium in 2020, up 30 percent from the $6.4 billion reported in 2019. Of this, recurring business accounted for $0.8 billion and portfolio business represented $7.5 billion.
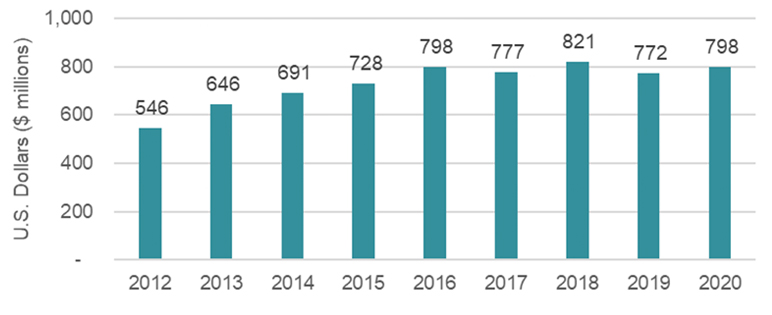
Traditional (i.e., excluding portfolio and retrocession) in-force group premiums in the U.S. increased by 3 percent to $798 million in 2020 following a decrease in premium in 2019. Furthermore, group in-force premiums grew 46 percent from $546 million in 2012 to $798 million in 2020 (see Figure 6), a CAGR of 5 percent.
Figure 6
U.S. In-force Traditional Group Premiums
As shown in Table 4, the top three reinsurers in the U.S. group life reinsurance market for traditional business are Swiss Re, Munich Re and RGA. Collectively, these three companies account for 82 percent of the market. Swiss Re, Munich Re and RGA reported changes in 2020 traditional premium of 3 percent, 10 percent and -14 percent, respectively.
Table 4
U.S. Traditional In-force Group Premiums ($ millions USD)
In-force group portfolio premium totaled $7.5 billion in 2020, up 33 percent from last year’s $5.6 billion. Portfolio premium originates from two reinsurers. Canada Life Re reported $5.6 billion in portfolio premium in 2020, up from $4.0 billion in 2019. Munich Re reported $1.9 billion in 2020 versus $1.6 billion reported in 2019.
Canada—Group Life
Next, we look at results for the group life insurance market in Canada.
Group life reinsurers in Canada reported $151 million of in-force premium in 2020. For 2020, in-force group premium increased by 13 percent as compared to 2019. Similar to the U.S., the group market in Canada is dominated by Munich Re, RGA and Swiss Re. These three account for 96 percent of the market share (see Table 5). Of the five reinsurers reporting material volume, all reported increases in traditional in-force premium versus 2019.
Table 5
Canada Traditional In-force Group Premiums ($ millions CAD)
Looking Ahead
Life reinsurance financials in 2021 and beyond will be influenced by a range of exogenous factors:
- U.S. regulatory measures such as revisions to IRC 7702 and the Biden tax plan.
- Continued evolution of sales trends due to COVID-19, and the ability of the U.S. and Canada to manage ongoing vaccination rollouts and the emergence of new COVID-19 strains.
- Ongoing economic recovery from historically low interest rates, job losses and business failures/interruption.
- The continued expansion of accelerated underwriting programs and face amounts.
- Increased awareness of adverse health exposure among key segments of the population (elderly, service workers).
- Continued aging of the population and changing consumer preferences.
- Increased competition and insurers’/reinsurers’ ability to address their technology burdens and develop innovative solutions.
- Carrier efforts to navigate and adopt IFRS17 and GAAP LDTI.
Life reinsurers are equipped to support direct carriers in addressing the challenges posed by these factors. Reinsurers’ expertise goes beyond traditional mortality and risk selection and includes financial reinsurance as well as value-added expertise in areas such as program development, underwriting operations, predictive analytics/risk selection, post-issue monitoring and risk management. This expertise and support can be invaluable to direct writers as many look to expand their offerings, improve outreach to consumers and enhance controls.
Reinsurance remains a valuable tool for efficient capital and volatility management. Financial reinsurance structures and reinsurance of in-force blocks, either for non-core businesses or as a means to manage profitability, continue to be attractive levers for direct writers.
Thank you to all the reinsurers that participated in this year’s survey. Complete results are available at https://www.munichre.com/us-life/en/perspectives/life-reinsurance-survey/survey-results-2021.html
Note that Munich Re prepared this survey on behalf of the Society of Actuaries Reinsurance Section as a service to section members. The contributing companies provide the data in response to the survey. The data is not audited, and Munich Re, the Society of Actuaries and the Reinsurance Section take no responsibility for the accuracy of the figures.
Statements of fact and opinions expressed herein are those of the individual authors and are not necessarily those of the Society of Actuaries, the newsletter editors, or the respective authors’ employers.
Anthony Ferraro, FSA, MAAA, is vice president, Individual Life Reinsurance at Munich Re. He can be reached at aferraro@munichre.com.
Joe Lario, FSA, MAAA, is R&D lead, Individual Life Reinsurance at Munich Re. He can be reached at jlario@munichre.com.


